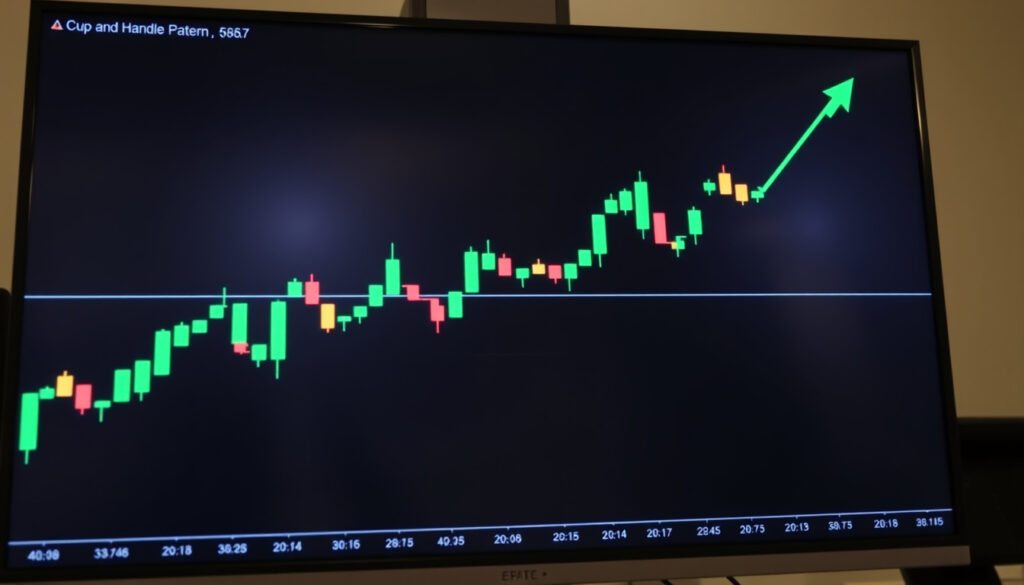
Cup and Handle Pattern: Rules, Targets, Examples Guide
Traders spend years chasing the perfect entry point, but one pattern keeps showing up on price charts with surprising consistency. The cup and handle has a reputation for rewarding patience—if you know what to look for. This guide walks through the identification rules, backtested success rates, and a rare 45-year example in silver that played out in real time.
Pattern Type: Bullish continuation · Typical Cup Duration: 7-65 weeks · Handle Formation: Downward drift 10-15% · Breakout Volume: 50%+ above average · Target Projection: Cup depth added to breakout
Quick snapshot
- Bullish continuation pattern (Investing.com)
- Shape resembles a teacup on charts (Quantified Strategies)
- Best on daily or weekly timeframes (Quantified Strategies)
- Exact success rate varies by market and timeframe
- Post-2025 silver performance data unavailable
- Conflicting handle durations reported for silver (13-18 years)
- Silver cup formed 1980-2011 (31 years)
- Silver handle 2011-2024 (13 years)
- Breakout on November 28, 2025, to $55/oz
| Label | Value |
|---|---|
| Formation | Cup drop, rise, handle drift |
| Bullish Signal | Yes (per Investopedia, IG) |
| Best Charts | Daily, weekly |
| Entry Point | Breakout above handle |
Is cup and handle a bullish pattern?
The cup and handle ranks among the most widely recognized bullish continuation patterns in technical analysis. When properly formed, it signals a pause in an uptrend before prices push higher.
Characteristics of the cup formation
The cup resembles a rounded “U” shape—not a sharp V—formed when prices decline, stabilize at a bottom, and recover to near prior highs. Depth should be 30-50% of the preceding rally, according to Quantified Strategies (technical analysis publication). Cups lasting 7-65 weeks tend to produce more reliable signals than shorter formations.
Role of the handle in confirmation
The handle follows as a slight downward drift, resembling a flag or pennant consolidation. LuxAlgo (AI backtesting platform) specifies that handles should slope down 10-15%, last 1-4 weeks, and stay above 50% Fibonacci retracement for maximum reliability. When the handle retraces more than one-third of the cup’s advance, profitability erodes.
Comparison to reverse patterns
The reverse cup and handle (or inverted cup and handle) functions as a bearish reversal pattern. It appears as a downward-rounded “U” followed by a pullback consolidation and breakdown. While structurally similar, the reverse pattern signals distribution rather than accumulation. Commodity markets like silver may extend pattern durations significantly beyond the 6-12 months typical for equities, because physical supply-demand constraints slow trend reversals.
What timeframe is best for cup and handle?
Daily and weekly charts consistently outperform shorter timeframes for identifying reliable cup and handle patterns. Traders on shorter frames often mistake noise for formation.
Daily vs weekly charts
Daily charts allow traders to track intra-week price action while filtering out minor fluctuations. Weekly charts smooth out noise further, revealing the longer-duration cups (7+ weeks) that historically produce stronger signals. LuxAlgo reports success rates climbing from 70% for 1-year holds to 85% for 10-year holds, suggesting longer timeframes reward patience.
Intraday limitations
Intraday charts (hourly, 15-minute) rarely show the complete cup structure because the pattern requires weeks or months to form. Attempting to trade cup and handle on a 15-minute chart produces false breakouts and shallow handles that fail to develop.
Cup and handle pattern time frame rules
Based on backtested data from LuxAlgo, the ideal framework: cups lasting 7-65 weeks, handles 1-4 weeks. Filtering patterns occurring above a rising 200-day moving average cuts failure rates nearly in half. Commodity patterns like silver extend this further—silver’s cup formed over 31 years (1980-2011), followed by a 13-year handle (2011-2024).
What are the cup and handle pattern rules?
Precise rules separate profitable cup and handle trades from false breakouts. The pattern has measurable criteria at each stage.
Step-by-step identification
- Confirm an existing uptrend. Patterns forming within downtrends or ranges carry lower success rates.
- Identify the cup: a decline, rounded bottom, and recovery to within 30-50% of the prior high. The cup must be U-shaped, not V-shaped.
- Wait for handle consolidation: after the cup recovers, price drifts sideways or downward for 1-4 weeks. The handle must hold above the cup’s halfway point and not retrace more than one-third of the cup’s advance.
- Confirm volume on breakout: enter when price breaks above handle resistance on expanding volume at least 40% above the 20-period average.
- Place stop-loss below the handle’s low point, typically 8-12% below the breakout level. Some traders prefer stopping below the 200-day moving average when the pattern forms above it.
Volume confirmation requirements
Volume follows a specific rhythm. It declines during the cup’s formation and recovery, then spikes on breakout. LuxAlgo specifies a volume spike 40% above the 20-period average on the breakout day. Low volume on the breakout often indicates a false move.
Stop-loss placement
Place stops below the handle’s low point, typically 8-12% below the breakout level. Some traders prefer stopping below the 200-day moving average when the pattern forms above it. The risk-reward ratio averages 2.5:1, improving to 4:1 with additional filters like volume confirmation and trend alignment.
What is the cup and handle pattern target?
Pattern targets derive from measuring the cup’s depth and projecting that distance from the breakout point. The method is straightforward but requires discipline.
Measuring cup depth
Measure from the cup’s highest point (the rim) to the lowest point (the bottom). This vertical distance represents your initial target zone. Quantified Strategies notes that deeper cups require longer right-side recovery periods and may produce wider price swings.
Projection from breakout point
Add the cup’s depth to the breakout price (where the handle resistance breaks). For example, if the cup depth is $10 and breakout occurs at $50, initial target sits at $60. Investing.com reports silver’s measured move targets as $80-85 conservative and $400-600 extended, based on the multi-decade cup depth.
Risk-reward application
Compare your target against the stop-loss distance. LuxAlgo data shows the pattern averages a 2.5:1 risk-reward ratio, rising to 4:1 when filtered for patterns above the 200-day moving average and with volume spikes exceeding 40%. Swing traders on Trade That Swing report 10-30% profits in 1-3 weeks on well-formed patterns.
What is the cup and handle pattern success rate?
Backtested data reveals a wide range depending on timeframe, filters applied, and market conditions. The raw baseline sits lower than many traders expect.
Historical performance data
The baseline success rate across 3,000+ instances is 49%, according to LuxAlgo. However, filtered results improve dramatically: 70% for 1-year holds, 80% for 5-year holds, and 85% for 10-year holds. Hubbis (commodity analysis outlet) cites Thomas Bulkowski’s backtests showing 49-95% success rates depending on pattern quality, with average gains of 20-54% in bullish markets.
Factors improving reliability
Three factors consistently improve outcomes: patterns forming above a rising 200-day moving average, handles holding above 50% Fibonacci retracement, and volume spikes on breakout. Handles retracing less than one-third of the cup advance also correlate with higher success rates.
Examples in silver and stocks
Silver provides a landmark case. The metal formed a cup from 1980 to 2011 (31 years), a handle from 2011 to 2024 (13 years), and broke out on November 28, 2025, surging $3 to $55/oz above the $50 resistance level. The pattern completed after Discovery Alert (technical analysis publication) identified the signal. Equity patterns typically complete in 6-12 months, while commodities extend years due to supply-demand dynamics.
Thomas Bulkowski’s backtests span decades and thousands of patterns—a scale most individual traders cannot replicate. His 49-95% range reflects real variation between textbook patterns and sloppy formations.
Silver’s pattern took 45 years to complete. Traders who dismissed it as irrelevant during the handle phase missed the eventual breakout. Commodity patterns demand patience that equity traders rarely need.
How to trade the cup and handle pattern step by step
Traders apply these rules to enter positions, manage risk, and lock in profits. Each stage of the pattern requires specific behavior.
Step 1: Identify the prior uptrend
Confirm prices are in a defined uptrend before searching for the cup. Patterns forming within downtrends or ranges carry lower success rates.
Step 2: Locate the cup formation
Watch for a price decline, rounded bottom, and recovery. The cup should span 7-65 weeks with a U-shaped rather than V-shaped bottom. Depth should be 30-50% of the prior rally.
Step 3: Wait for handle consolidation
After the cup recovers, price drifts sideways or downward in the handle phase for 1-4 weeks. The handle must hold above the 50% Fibonacci retracement of the cup advance and not retrace more than one-third of the cup’s height.
Step 4: Confirm volume on breakout
Enter when price breaks above handle resistance on volume at least 40% above the 20-period average. Place a stop-loss below the handle low (typically 8-12% below entry).
Step 5: Measure and manage the target
Add the cup’s depth to the breakout price to establish your target. Consider taking partial profits at the initial target while trailing a stop to capture extended moves.
Upsides
- High success rate (70-85%) with proper filters
- Clear entry, exit, and stop-loss points
- Applicable across stocks, commodities, and forex
- Risk-reward averages 2.5:1, up to 4:1 with filters
Downsides
- Requires weeks to months to fully form
- Shallow handles may fail to develop
- False breakouts common without volume confirmation
- Not suitable for short-term or intraday trading
Thomas Bulkowski’s backtests show the cup and handle produces 49-95% success rates depending on pattern quality, with average gains of 20-54% in bullish markets — Hubbis (commodity analysis outlet)
Filtering out patterns occurring below a declining 200-day moving average cuts failure rates nearly in half — LuxAlgo (AI backtesting platform)
Mike believes this pattern could push silver beyond $150—possibly to $300, $400, or even $500+ per ounce — GoldSilver (precious metals analysis)
Related reading: ANZ Cuts Interest Rates · Best Home Loan Rates NZ
markets.financialcontent.com, dukascopy.com, goldsilver.com, equentis.com, youtube.com
Technical analysts rely on the cup and handle pattern’s teacup silhouette for bullish signals, with practical insights from this identification and trading guide.
Frequently asked questions
What are cup and handle pattern examples?
Silver’s 45-year formation from 1980 to 2025 represents the most documented multi-decade example. The cup bottomed at $4-6/oz in the early 2000s, the handle tested $49-50 resistance, and breakout occurred on November 28, 2025, at $55/oz. Equity examples typically complete within 6-12 months.
What is the reverse cup and handle pattern?
The reverse cup and handle (inverted cup and handle) is a bearish reversal pattern. It forms as a downward-rounded cup followed by a pullback consolidation and breakdown below handle support. The rules mirror the bullish version but signal distribution rather than accumulation.
What is cup and handle pattern silver?
Silver exhibited a 45-year cup and handle from 1980 to 2025. The cup spanned 1980-2011 (31 years), the handle 2011-2024 (13 years). The metal broke out to $55/oz on November 28, 2025, above $50 resistance. Measured move targets range from $80-85 (conservative) to $400-600 (extended).
What is the 90-90-90 rule for traders?
The 90-90-90 rule generally refers to statistics about trading account failures (90% of traders lose 90% of their capital within 90 days). It underscores why mechanical patterns like the cup and handle—backtested and rule-based—appeal to traders seeking structure over impulse.
What is the 3-5-7 rule in trading strategy?
The 3-5-7 rule typically refers to pattern recognition timing: wait for 3 confirmations, enter on 5% pullback, and take profit at 7% extension. Applied to cup and handle, traders may wait for three touches on the cup rim, enter during the handle consolidation, and target a 7% extension beyond the breakout level.
What is the most successful trading pattern?
Thomas Bulkowski’s backtests rank the cup and handle among the top performers, with success rates of 49-95% depending on pattern quality and filters applied. The pattern offers clear entry and target rules, making it more actionable than subjective formations.
What is Warren Buffett’s 90/10 rule?
Warren Buffett’s 90/10 rule allocates 90% of assets to a low-cost S&P 500 index fund and 10% to high-risk investments. In pattern trading terms, it suggests most capital should follow high-probability setups (like filtered cup and handles) while a smaller allocation tests higher-risk opportunities.
More related posts
 Jacqui and Clint MAFS: Still Together? Wedding & Updates
 Truck Driver Jobs Auckland: Requirements & Salary Guide
 Sam Neill Movies and TV Shows: Full List & Highlights
 Unimog for Sale in NZ: Prices, Reliability & Buying Guide
 FreshChoice Pyes Pa: Store Hours, Services, and Owner Info
 House for Sale Pukekohe: Listings, 3-4 Bed Homes & Prices
 Arsenal F.C. vs PSV Eindhoven Lineups: 7-1 Win Match Recap
 Turtle Beach Stealth 600: Review, PS5 Setup, Comparisons